Our toolbox
In this section we'll list the tools we will use throughout the book, give a short description of them and where to get them.
GHC
GHC comes with a time and space profiling system. The output of that system is used by other tools to provide further insight than what GHC offers by default.
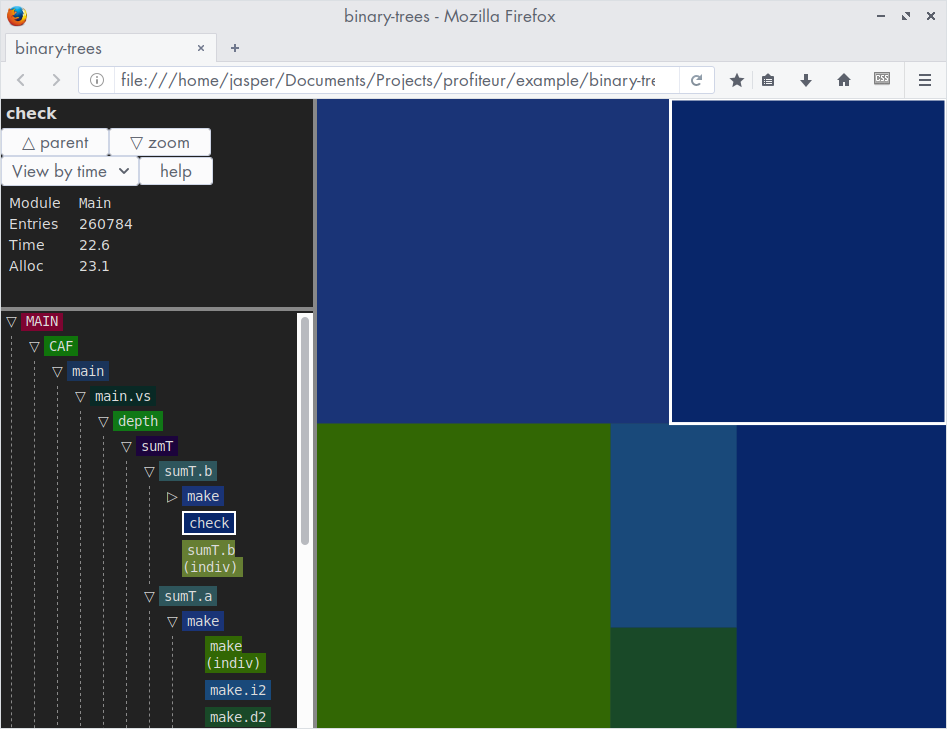
profiteur
An interactive treemap visualiser for GHC .prof files.
profiterole
Alternative textual views of the profiling data generated by GHC.
hp2ps
A tool used to convert a .hp file produced by GHC into a PostScript graph of heap profile. This tool is bundled with GHC.
eventlog2html
A tool to visualise eventlogs. In particular, it creates interactive charts for the heap profiling information included in the eventlog.
ghc-debug
A set of libraries which allow you to inspect the heap of a running Haskell program from an external debugger.
ghc-event-analyze
A profile tool that uses GHC's eventlog system. It is useful for profiling code when GHC's normal profiling mode is not available, or when using profiling mode would perturb the code too much. It is also useful when you want time-profiling information with a breakdown over time rather than totals for the whole run.