About this book
This book is a community-driven effort to provide a document describing how to write idiomatically fast Haskell by providing insight into how Haskell behaves under the hood, describing various techniques and tools used to identify performance issues, categorizing common performance issues, and demonstrate how to tackle performance problems step-by-step using case studies.
Our toolbox
In this section we'll list the tools we will use throughout the book, give a short description of them and where to get them.
GHC
GHC comes with a time and space profiling system. The output of that system is used by other tools to provide further insight than what GHC offers by default.
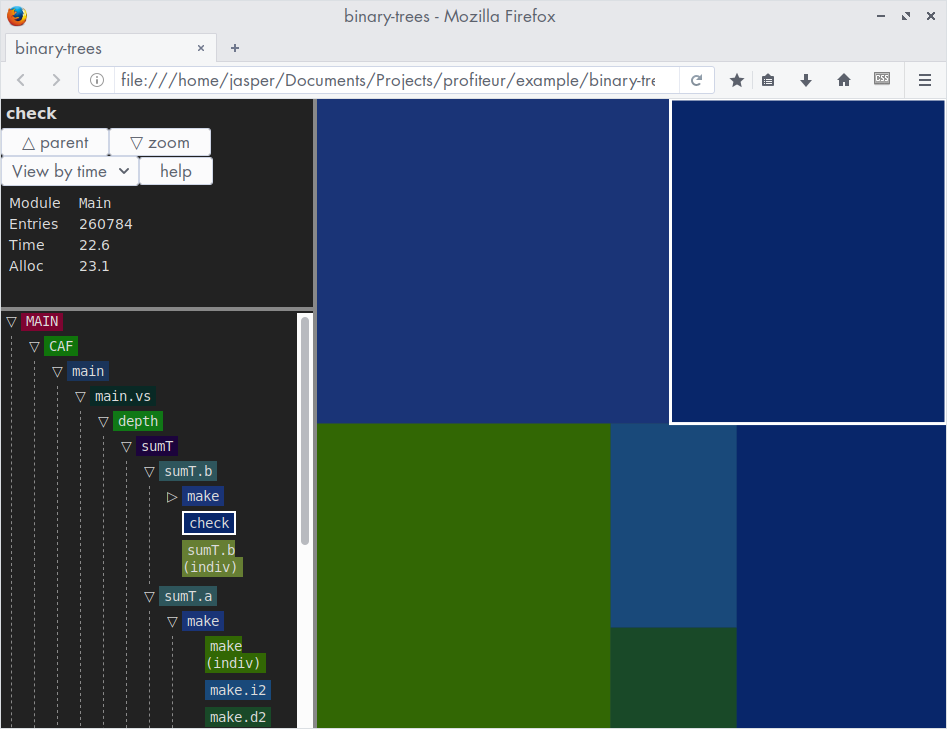
profiteur
An interactive treemap visualiser for GHC .prof files.
profiterole
Alternative textual views of the profiling data generated by GHC.
hp2ps
A tool used to convert a .hp file produced by GHC into a PostScript graph of heap profile. This tool is bundled with GHC.
eventlog2html
A tool to visualise eventlogs. In particular, it creates interactive charts for the heap profiling information included in the eventlog.
ghc-debug
A set of libraries which allow you to inspect the heap of a running Haskell program from an external debugger.
ghc-event-analyze
A profile tool that uses GHC's eventlog system. It is useful for profiling code when GHC's normal profiling mode is not available, or when using profiling mode would perturb the code too much. It is also useful when you want time-profiling information with a breakdown over time rather than totals for the whole run.
What makes programs go fast?
In this chapter we'll explore how Haskell behaves under the hood.
We'll take a look at Haskell's evaluation semantics, laziness/strictness and how to control it, how to represent data wrt performance, allocation and its affect on performance, how various GHC affect performance, and more.
Evaluation in Haskell
In this section we'll take a look at Haskell's evaluation semantics, laziness, strictness and how they affect performance, and what to avoid.
Allocation and data representation in Haskell
In this section we'll explore how allocation affects the performance of programs, and how to keep it under control.
GHC optimizations and you
In this section we'll explore a few optimizations GHC provides that a Haskell programmer should be aware of, and how they affect the code we write.
Classifying performance issues
In this chapter we'll try to classify a few common performance problems in Haskell applications and give tips on how to avoid them.
Finding performance issues using profiling
In this chapter we'll explore various tools and techniques currently available to us in order to identify the causes of performance problems.
Cost-center profiling
Heap profiling
Automated testing for performance regressions
Case studies
In the chapter we'll show how to tackle performance issues step-by-step by exploring case studies.
Parsing and processing
Streaming
Web service
Architecture
Where to go next
For now this will be a list of references
Understanding Haskell
- High-performance Haskell
- Low-level Haskell (STG)
- Intro to low-level Haskell Optimization
- Performance section in hsp
- Haskell ghc illustrated
Performance tips
- GHC - Producing a program that runs quicker
- Good rules of thumbs (Reddit discussion)
- Haskell to Core: Understanding Haskell Features Through Their Desugaring
- Ideas for optimizing Haskell
Profiling
- GHC - profiling
- FP Complete/profiling
- Optimizing Haskell Programs methodology
- Memory fragmentation & deeper look
- Profiling section in hsp
Tools
- profiteur
- profiterole
- Info table profiling
- Memory usage zurihac 2021 repo and talk
- ghc-debug
- ghc-events-analyze
- eventful ghc
- eventlog2html
Case studies
- Performance case studies section in hsp
- Effects for less
- Sharing, Space Leaks, and Conduit and friends
Automated testing
Contributors
This is the list of contributors to the Haskell Performance Tuning Book project:
| Name | Username |
|---|---|
| Name | [@username](https://github.com/username) |